
Design research · TV
Queue on TV
Led a 3-day diary study followed by moderated prototype interviews into adding a queue to the Spotify TV app, understanding mvp before several engineering-months of investment. The feature shipped and boosted consumption and retention as key company metrics, with TV MAUs who adopted the queue consuming significantly more content, their average TV usage far exceeding non-adopters by January 2024.
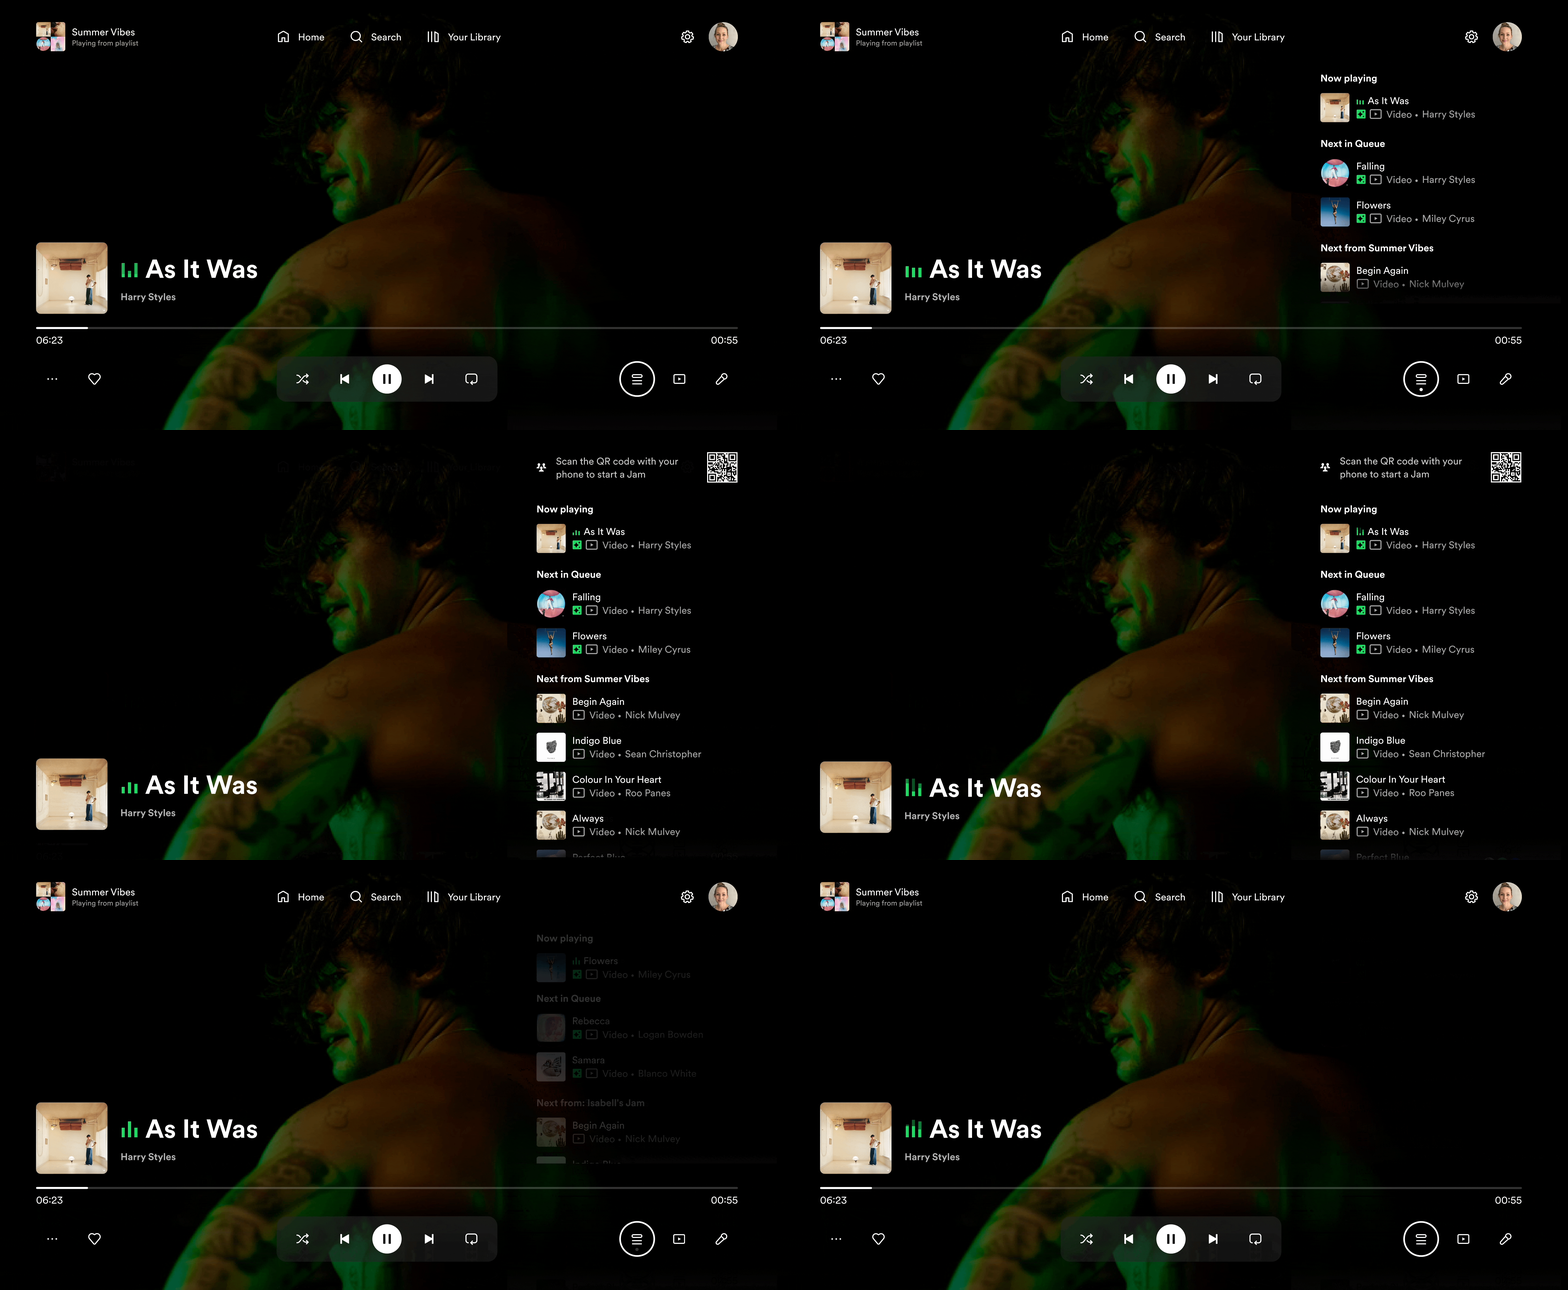
Context of this project. The Queue is not available on the Spotify TV app ↗︎. Songs are queued via Mobile, Laptop or Tablet. TV is mainly used as a speaker. Previous research indicates a desire to manage songs directly on the TV app, particularly in social settings.
Business Problem — Should we build it, and how? Building this would take several engineering months. Is it worth the investments, and if so — what should the team focus on?
What can we learn from research? ⭐ Learn how the TV queue boosts engagement during shared listening. ⭐ Gain insights into the TV queue use across different devices.
Should we build it, and how?
TODO — add copy: the business + user problem, and what you got wrong.
TODO — add copy: your scope, influence and what you initiated.
TODO — add copy: the decision you took, before the solution.
Part 1. Conduct a 3-day diary study on current queue usage.
Research goals are: 🌟 Understand how TV users and their household members interact with the queue across different devices. 🌟 Note: TV currently lacks a queue feature.
Part 2. Analyze findings. Share insights with stakeholders. Implement insights into prototype design.
Part 3. Conduct moderated interviews with prototype stimuli, involving selected diary study participants.
Research goals are: 🌟 Understand users’ first impressions of the TV queue. 🌟 Investigate simplifying queue control and account access. 🌟 Determine if users expect to rearrange the queue using the remote control.
Part 4. Review findings during another analysis week. Deliver final results to the team and stakeholders.
I delivered an insight report together with the designer, combining user feedback from a diary study and prototype testing. These insights helped the team evaluate the value of a TV queue feature and prioritize engineering efforts accordingly.
Results of the launch of this feature on the TV experience & across the Spotify ecosystem. This research directly led to the development of the TV queue, which boosted consumption and retention — key company metrics.
Results showed that Queue contributed to an increased engagement during shared listening sessions. With TV Monthly Active Users (MAU) adopting the queue consumed significantly more content. In January 2024, their average TV usage far exceeded that of non-adopters, highlighting the feature’s impact.
TODO — add copy: what you would do differently.